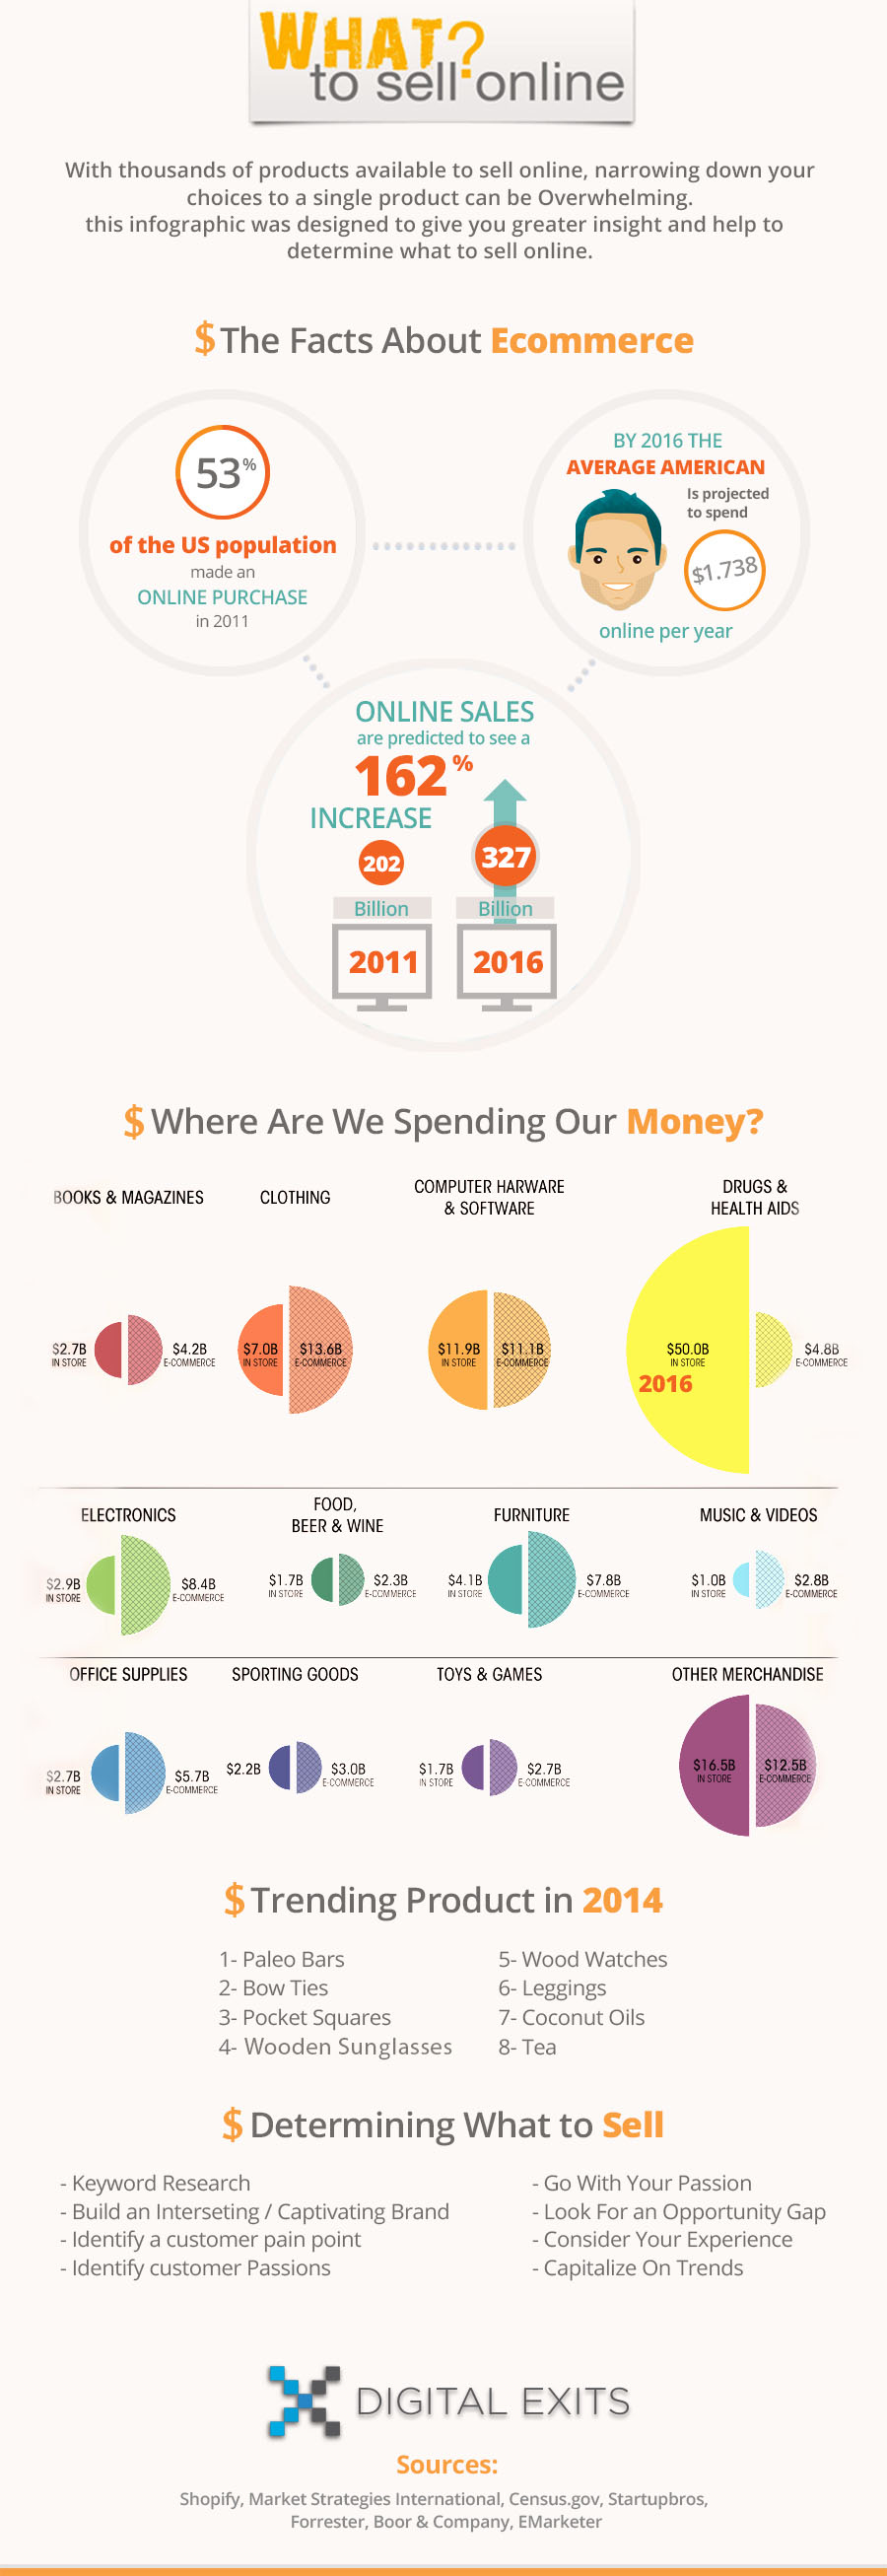
With $13.6 billion Clothing is the leading e-commerce category. The e-commerce business brokers at Digital Exits have put together this infographic with more interesting numbers and a breakdown that looks at in-store vs online. The anticipated increase in total online sales between 2011-2016 is 162%. What is more interesting is where customers spend their money. After clothing come books, music, furniture, electronics and food. For more on the future of how we shop – checkout our previous post.
Categories
- Apparel Ecommerce
- Channel Sales and Comparison Shopping
- Checkout Management
- Client Case Study
- Cloud, CDN and Scalability
- Customer Management
- E-commerce Trends
- eBooks
- Finance, Tax and ERP Tools
- Fraud & Chargeback Prevention
- International Features
- Inventory Management
- Merchandising Manager
- Mobile eCommerce
- Order Management
- Reports and Analytics
- SEO and Marketing
- Shipping and Fulfillment
- Uncategorized
- Wholesale Management
-
Recent Posts
Archives
- April 2016
- January 2016
- December 2015
- August 2015
- July 2015
- June 2015
- May 2015
- April 2015
- March 2015
- February 2015
- January 2015
- December 2014
- November 2014
- October 2014
- September 2014
- August 2014
- July 2014
- June 2014
- May 2014
- January 2014
- September 2013
- July 2013
- May 2013
- April 2013
- December 2012
- November 2012
- October 2012
- September 2012
- August 2012
- June 2012
- May 2012